- Item


The Dormaa Central Municipal has an average household size of four (4) and an average of three (3) persons per household. This translates into an average of 12 persons per house.
Household Income Pattern
The average annual income for an average household size of four for the sample population is ¢5,317,282. This translates into an average per capital annual income of xxx... Majority of the people earn their income from agricultural activities (56%), industrial activities (19%), commercial activities (7.4%) and the service sector (23.6%). Income levels are generally low throughout the district as compared to the national average income per head of 3,705,000 (i.e. $390 at ¢9,000). There is the need to develop the major sectors of the Municipal economy especially agriculture through effective processing and marketing produce.
Income Distribution
High inequalities exist in the distribution of income in the Municipality. It was revealed by the field survey that the lower 26% of the population enjoyed 6% of the income while the top 14% enjoyed as high as 56% of the Municipal income. Presently, a large proportion of the low income group is found in the agricultural sector. Apart from improving income levels, there is the need to ensure a fair distribution of the income.
Expenditure Pattern
The average annual household expenditure for the sampled population is ¢7,053,210.00 while the annual per capital expenditure stands at xxx... This compares favourably with the annual the average national per capita expenditure of ¢987,000.00. The highest item of expenditure is food
(44.8%), as shown in the Table below:
Table: Expenditure Pattern In the Municipal
Expenditure Item | Percentage |
Housing | 6.7% |
Education | 10.3% |
Health | 15.2% |
Energy | 3.4% |
Water | 6.4% |
Food | 44.8% |
Clothing | 7.6% |
Funeral | 3.5% |
Miscellaneous | 2.1% |
Total | 100% |
Source: Field Survey, 2006
Poverty Level
The incidence of poverty in Ghana is measured at two levels; Upper Level and Extreme lower level. The upper poverty line in Ghana refers to income levels of up to ¢900,000 a year or ¢75,000 per month. The extreme poor are people with incomes below ¢700,000 a year or ¢58,000 a month. The current national statistics on poverty estimates is that about 40% of the national population has incomes below the upper poverty line; whilst about 27% of the population has incomes below the extreme poverty line.
With reference to the about indicated cut-off points, it was estimated form the field survey that 17.6% of the Municipality population are poor whilst 56.8% are extremely poor. The findings of the field survey corroborate the fact that poverty in Ghana is a rural phenomenon with the rural communities accounting for more that 60% of the poor. In terms of economic activity, poverty in the Dormaa Central Municipality is by far margin highest among food crop farmers. They may be attributed to low prices of their produce.
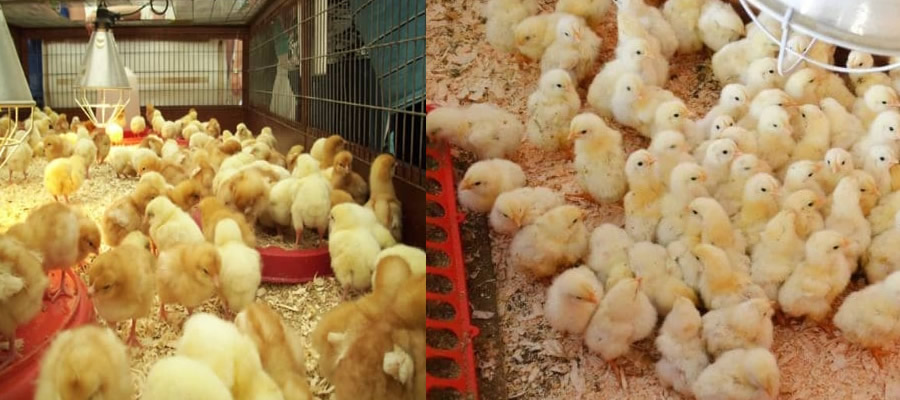
Mainly agricultural based. It employs about 60% of the Municipal Active Labour Force
- Main Food Crops cultivated in commercial quantities include; Maize, Plantain, Cassava, Cocoyam, Tomatoes and Pepper.
- Main Cash Crops are Cocoa and Coffee
Municipal finance
This section examines the structure of revenue and expenditure of the Municipality. The main sources of revenue to the district can be categorized into internal and external revenue sources. In general, the internal revenue sources are used to cover recurrent expenses of the Municipal Assembly. This leaves the central government grants and donor funds as a main source of funds for development or capital expenditure.
This section assesses the revenue and expenditure pattern of the Dormaa Central Municipality. Local
Revenue Structure
The sources of revenue to the Dormaa Municipality have been classified into three major categories:
• Internally Generated Fund (IGF) eg. Licences, rates, rents fees and fines.
• Transfers from Central Government including DACT, HIPC and GETfund.
• Donor Funds
• Other Inflows.
Over a period of three years, revenue from external sources continues as the major source of revenue to the district. Between 2003 and 2005, the external sources along accounted for an average of 87% of the district’s revenue. Over the same period IGF increased slightly as compared to external sources. Poor performance of some of the internal revenue items could be assigned to this reason. This level of performance is an indication of over dependence of the district on external sources for project implementation.
Expenditure Pattern
The expenditure pattern of the Dormaa Municipali can be divided into capital and recurrent aspects. The capital expenditure includes those incurred mostly under the restricted revenue items such as DACF, HIPC, CWSA, DFID, and GTZ among others. The common capital expenditure items include those on the construction of educational, health, water and sanitation facilities.
Another striking feature is the expenditure on personal emolument. This expenditure head though recurrent in form is incurred by the central government in the form of salaries which is also restricted. Besides the central government transfers for emoluments, the Assembly spent about % to % of its IGF on personal emoluments within the period 2003 – 2005. These funds were used to pay additional staff employed by the Assembly.
Performance of Revenue Items (2003 – 2005)
The major sources of Internally Generated Fund of the Municipal Assembly include lands, fees, fines, rates and rates investments among others. Out of these sources lands and licences have been the highest contributors to the IGF between 2003 – 2005. These two items accounted for 53%, 63.6% and 65.7% respectively. This indicates that some of the revenue items are not productive enough and therefore need re-assessment and total up dating of the district tax register. The major components of these items are farm produce, rates, entertainment.
Some of the revenue items experienced some increased over the 2003 – 2005 period. For instance revenue from licences increased from 9.8% in 2003 to 15.5% in 2005. The increment experienced in some of the revenue items can be attributed to rate increases and the tapping of new revenue sources. For instance, the increase of revenue from lands was as a result of the increase in stool lands revenue inflow whilst increased revenue from licences (12.7 in 2003, to 15.5% in 2005) was a result of the widening of the tax net to cover new sources such as the kiosk owners and property rates. To ensure realistic revenue targeting and co-operation of the payers, there is the need for continuous broad-based participatory approach to fee fixing.
Challenges in Revenue Mobilisation
Most of the sources are unproductive or are low yielding, and capacity of revenue collective is low in terms of skills and logistics. Most taxable concerns still remain outside the district’s revenue books. At the moment, with technical support form GTZ, the District Assembly is in the process of putting up measures to step-up the collection of property and economic activities rates.
pocc
The Potentials, Opportunities, Constraints and Challenges (POCC)
Analysis is a tool used to streamline development issues and interventions before they are programmed for implementation. This analysis is important in assisting to fine-tune development goals, objectives, policies and strategies
Key Development Problem
- Poor Condition of Roads
- Inadequate supply of potable water
- Inadequate toilet facilities
- Poor marketing and distribution of farm produce
- Low access to electricity
- Low levels of production and productivity.
- Low levels of employment opportunities
- Poor and inadequate educational infrastructural facilities
- Inadequate Health Infrastructural Facilities
- Poor environmental sanitation
- Low private sector competitiveness
- Poor environmental conservation.
Potentials
- Availability of local construction materials
- Availability of Labour
- Presence of the Department of Feeder Roads
- High water table
- Willingness of communities to contribute matching fund.
- DACF
- MPs Funds
- Willingness of the people to contribute financially.
- Assistance from Municipal Assembly
- Cesspool emptiers.
- Tractor and Container
- Municipal Environmental Health Unit.
- Final dumping site.
- Youth in sanitation component of NYEP.
- I G F - Availability of basic infrastructural facilities eg. Roads, Electricity, Telecommunication, School and Clinics.
- Availability of trained personnel.
- Existence of Business Advisory Centre.
- Availability of local entrepreneurs.
- Availability of land for investments
- Forest resources.
- Water bodies
- Wild life.
- Favourable traditional conservation practices.
- Existence Institutions for Environmental Management.
- Existence of District Anti-Bush Fire Committee
Opportunities
- District Assembly Common Fund (DACF)
- CBRDP
- Central government fund.
- Donor Partners
- High demand in urban centres.
- Existence of Agro-processing facilities.
- A venue exists for non-traditional exports.
- Government Rural Electrification Project.
- Bimodal rainfall.
- Accessibility of the District to other external markets.
- IFAD/REP Support.
- The presence of CBRDP, GTZ (RUTTIP)
- Tax incentives (holidays etc)
- HIPC
- GETfund
- MPs Fund
- NGOs Support.
- Additional resources from the DACF.
- Transfers from the Stool Lands Administration.
- Resources from the HIPC fund.
- The presence of health training institutions.
- MPs Fund
- Readily DACF available non forest energy HIPC business climate eg. Tax exemptions.
- Availability of Export Development Investment Fund (EDIF) Fund and Venture Capital Fund.
- Existence of the Media
- HIPC Plantation Development Fund.
- Forest Plantation Development Fund.
- Environmental Conservation Bye-laws.
Constraints
- High erosion and high cost road construction
- High Capital requirements
- Poor road conditions in farming communities.
- Inadequate storage facilities
- Inadequate Agro-processing facilities.
- Low income levels.
- Dispersed settlement pattern.
- Inadequate knowledge of appropriate technology.
- Inadequate credit facilities.
- Few Agricultural Extension Agents.
- Unavailability of irrigation facilities.
- Inadequate skilled manpower.
- Low access to start-up capital.
- Inadequate information on potential
- Inadequate funds.
- Large district size.
- Adequate logistics.
- Apathy on communal labour.
- Inability to provide marching funds to benefit from other donor support.
- High cost of construction materials.
- Dispersed settlement pattern
- Largeness of district.
- Poor Maintenance Culture
- Poor revenue collection.
- Inadequate qualified revenue collection staff.
- Inadequate transport facilities.
- Low co-operation from tax payers
- Poor supervision.
- High staff turnover.
- Inadequate residential accommodation
- Inadequate staff.
- High level of illiteracy.
- Absence of designated sanitation sites
- Inadequate support infrastructure.
- Poor access to credit facilities.
- Inadequate raw materials.
- High incidence of bushfire.
- High rate of erosion.
- Illegal chain saw operations.
Challenges
- Torrential rainfall
- Inadequate and irregular inflow of fund for routine maintenance.
- Untimely release of GOG funds
- Irregular donor inflows.
- Low prices for farm produce.
- Phasing of electrification projects.
- Over dependence on Hydro Electric power.
- Perennial low level of water in Akosombo dam.
- Prevalence of bush fires.
- Highly dependent on natural rainfall.
- Laxity on the part of prospective investors to invest in the district.
- High leading rates.
- Delays in the release of the funds.
- Untimely and irregular release of government and donor funds
- Delays in the release of DACF and transfers from Stool Lands Administrator.
- Delays in posting of health personnel.
- High cost of training.
- High cost of sanitation management.
- High leading rates.
- Land litigation
- Untimely release of inflows.
- Difficulty in marketing farm produce and manufactured products.
- Demand for collaterals when accessing loans.
- Drying up of water bodies.
- Poor enforcement of environmental legislations.
- Inadequate funds.
Date Created : 11/16/2017 1:23:03 AM


Local Gov Ministry
Int of Local Gov Studies
Ministry of Information
Local Gov Service
Ghana MPs
Ghana Hospitals
NALAG
 facebook
 twitter
 Youtube
 +233 593 831 280
+233 20 230 9497
+233 593 831 280
+233 20 230 9497 0800 430 430
 GPS: GE-231-4383
 info@ghanadistricts.com
 Box GP1044, Accra, Ghana