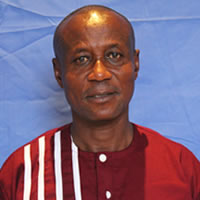
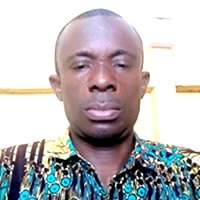
The District Assembly
The Birim South District Assembly is the highest political authority entrusted with umbrella responsibilities for the sustainable development of the district.
District Administrative Sub-Structure
The Assembly has a structure comprising the Assembly itself, three (3) Urban/Area/Town Councils namely, Akim Swedru Urban Council, Achiase Town Council, Aperade Area Council, There are also unit committees. These councils exist to ensure smooth administration, promote decentralization system of governance and bring decision making process closure to the people at the local level.
Composition of the District Assembly
The District Assembly is made up of thirty-two (32) Assembly members of which twenty-two (22) are elected and ten (10) appointed. One (1) Member of Parliament is ex-officio members of the Assembly. The District Coordinating Director is the Secretary to the Assembly. All Heads of Decentralized Departments as co-opted members of the Assembly.
The District Chief Executive, apart from being the political and administrative head of the district also serves as the chairman of the Executive Committee of the Assembly. The presiding member (PM) is the chairman of the Assembly (the highest political body in the district).
Decentralized Department and Other Agencies
There are about decentralized department and government agencies operating in the district. As functioning units of the Assembly, they assist the district and contribute to implementation of the decision of the Assembly.
The list of departments and agencies is presented in table 1.33.
The table also provides supplementary information on the equipment holding, problems staffing and equipment requirements whose availability would enhance their operating capacities.
Finances of the Assembly
The Assembly derives its revenue from two main sources, namely traditional/ locally generated and external including grants from central government and other donor funds. The major sources of the internally generated funds includes but not limited to basic and property rates, licenses, fees and fines and investments while the Central government’s sources includes District assemblies common Fund allocation, salaries and donor funds. Almost 95% of revenue generated is from DACF and donor funds which are used for capital expenditure while 80% of locally generated revenue constitutes recurrent expenditure. The remaining 20% goes to supplement expenditure of capital items. The tables below depict the revenue to the Assembly as well as the revenue and expenditure patterns over the past 4 year.
Revenue receipts for this defined period in relation to locally generated funds have shown some inconsistencies in the growth rate. Total receipts for this period is approximately ¢ 4,815,185,124. Inflows from external sources amount to 36.9 billion constituting the greatest source of funds for development interventions over the four year period. On the performance of locally generated revenue, inflows from lands have shown dominance over other forms of receipts. This laudable performance was as a result of the release of ceded components of stool lands. There is therefore the need to work hard on the other items under lands.
Fees and fines which constitute the second highest inflows have shown some improvement over the period but effort should be made to improve performance since it has the potential to generate more revenues.
Expenditure
Expenditure analysis shows an encouraging discipline and prudent use of financial resources on development interventions. It has however been observed that over the years, no amount from IGF has been spent on any physical/infrastructural development projects which was unacceptable. On the other hand, expenditure over 90%, a situation which might be partly blamed on increase in fuel prices, but management must improve expenditure design plans in this are.
Another are that needs serious attention is the expenditure on repairs and renewals which for example jumped over 67% increase. There is therefore the need to put in effective control measures to reduce such expenditures.
Revenue Projections
The analyses of local revenue generated from 2003 – 2004 have shown a growth rate of 26% and a fall in performance from 2004 – 2005 to about 0.2%. However, the total growth rate for the period is about 5.1%. this is in sharp contrast to the growth rate of about 60% for the DACF. Assuming the average growth rate of 5.1%, is maintained, it is expected that, total revenue (IGF) to be generated between 2006 and 2009 is estimated at ¢3.85 billion.
For the DACF, the average percentage growth rate is about 16.3%. This brings the expected inflows to an approximate amount of 31.8%.
Problems Confronting Revenue Mobilization
- Poor monitoring and supervision by management
- inadequate of motivation for revenue staff
- Poor market and public facilities
- Low publication on rates payment
- Non-enforcement of bye-laws
- Inadequate logistics, such as Wallington boot, rain coat, vehicle or transport facilities, computers for the rate collection.
- Political interference in the implementation of laws and regulations
- Poor rates collection mechanism
- Low level of personnel manning revenue sections
- Lack of training programmes for the collectors
- Inadequate revenue data.
Recommendations
- Regular training of collector
- Recruitment of highly qualified personnel eg HND Accountancy to man the revenue section
- Improvement in revenue collection mechanism (computerization of revenue data).
- Improvement in the infrastructure in the markets
- Provide logistics- computers, rain coats, Willington boats, transport facilities.
- Institute incentives schemes and reward systems for collectors
- Improve monitoring and supervision of the collectors
- Update revenue data base
Date Created : 11/24/2017 12:50:39 AM


 facebook
 X (twitter)
 Youtube
 +233 593 831 280
 0800 430 430
 GPS: GE-231-4383
 info@ghanadistricts.com
 Box GP1044, Accra, Ghana